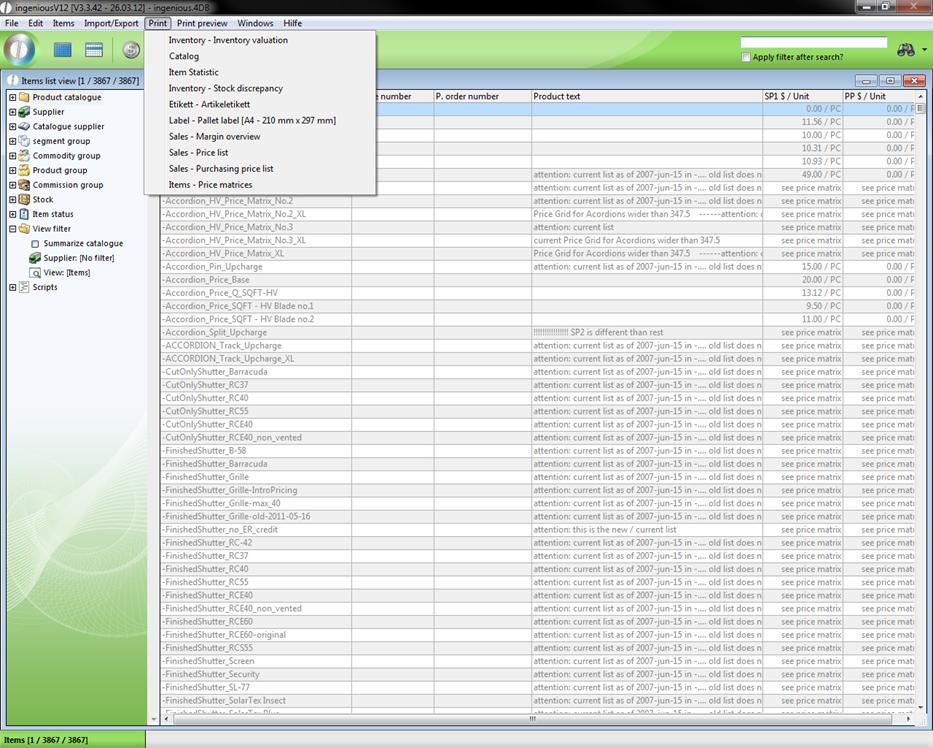
Under the menu item “Print” in the main menu of Ingenious.V12, one finds different printing templates that are divided into different areas (“Inventory”, “Item statistics”, “Label”, “Sales” and “Items”).
The “Inventory” area contains the inventory stock of the items. There are two different printing templates.
Inventory - Inventory valuation
In the printing option “Inventory valuation”, an evaluated inventory list that contains the following descriptions is printed:
- The item number
- The product description
- The hypothetical stock
- The actual stock
- The Purchase price
- The inventory value of an item
- The complete inventory value of all selected items.
Inventory - Stock discrepancy
On the other hand, the “Inventory” area contains the stock discrepancy (“Printing/Inventory – Inventory discrepancy). These lists contain:
- The order number
- The matchcode
- The suppliers
- The inventory date
- The hypothetical stock
- The sales price
- The minimum stock
- The purchase order proposal
- The purchase price unit
- The respective items
Label - Item label
For the labeling of individual items, there is a print function available in Ingenious.V12 called “Item label” (“Printing/Label – Item Label”). It contains the following:
- Item number
- Inventory
- Commodity group
- Cost center
- Short text
of the item.
Label - Pallet label A4
For the fast identification of your pallets, the assignment of pallet inscriptions or pallet labels is absolutely necessary. For this reason, Ingenious.V12 also offers you a suitable print function. On the pallet label (“Printing/Label - Pallet label A4 “), the following data are about the item are contained.
- Item number
- Stock
- Commodity group
- Cost center
- Matchcode
- Date
- Quantity
- Product picture
The sales area covers 3 printing templates: The “Margin overview”, the “Selling price list” as well as the “Purchasing price list”.
Sales - Margin overview
The margin overview (“Print/Sales – Margin overview”) contains the columns
- Item number
- Supplier
- Short text
- PP (Euro)
- SP (Euro)
- Margin (Euro)
- Margin (%)
- Stock
- PP/Unit
- Unit
- Value (Euro)
Sales - Price list
With the sales price list (“Printing/Sales – Price list”), you have all important sales item data to in “Black and White” in view. This list covers the following item data.
- Item number
- Matchcode
- Short text
- SP unit price
Sales - Purchasing price list
The sales price list (“Print/Sales - Purchasing price list”) is almost identical to the sales price list. Instead of the column “SP unit price”, you will find the column “Purchasing unit price”.
- Item number
- Matchcode
- Short text
- PP unit price
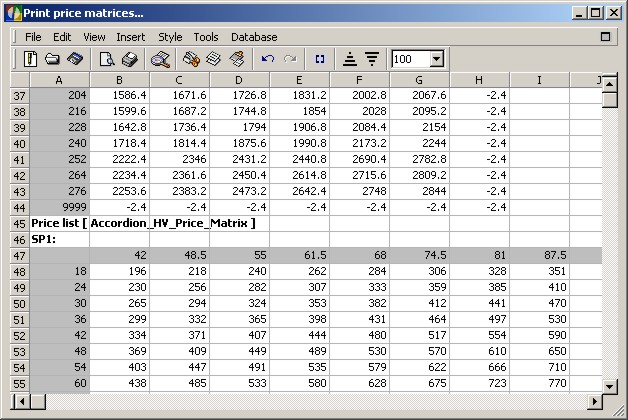
Item - Price matrices
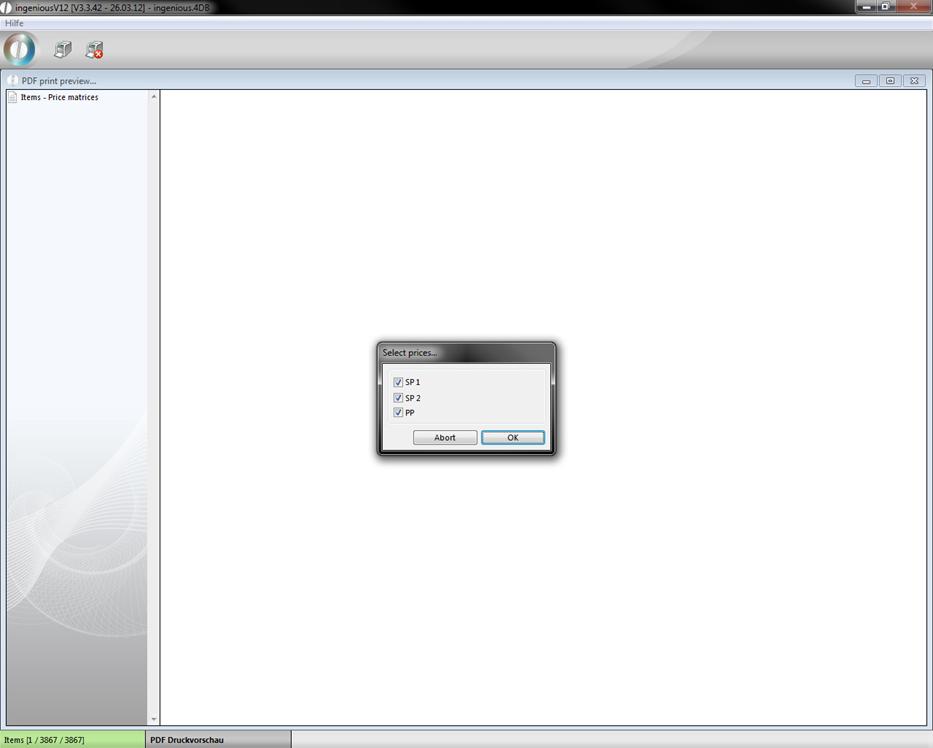
For the printing of two-dimensional price lists (i.e. width x height), the function “Items – Print price matrices” was developed. Here you can print your item price lists. You can thereby select which prices (PP, SP 1 or SP 2) are supposed to be indicated.
Practice printing lists
1. Open the desired files. In this example you should open the items in the folder “Awnings” of the product catalogue.
2. Select the print job “Sales - Margin overview” in the “Print” menu item.
3. A window appears to query further printing adjustments. Here select the options “All selected [6]” and “Show print preview” and confirm with the “OK” button.
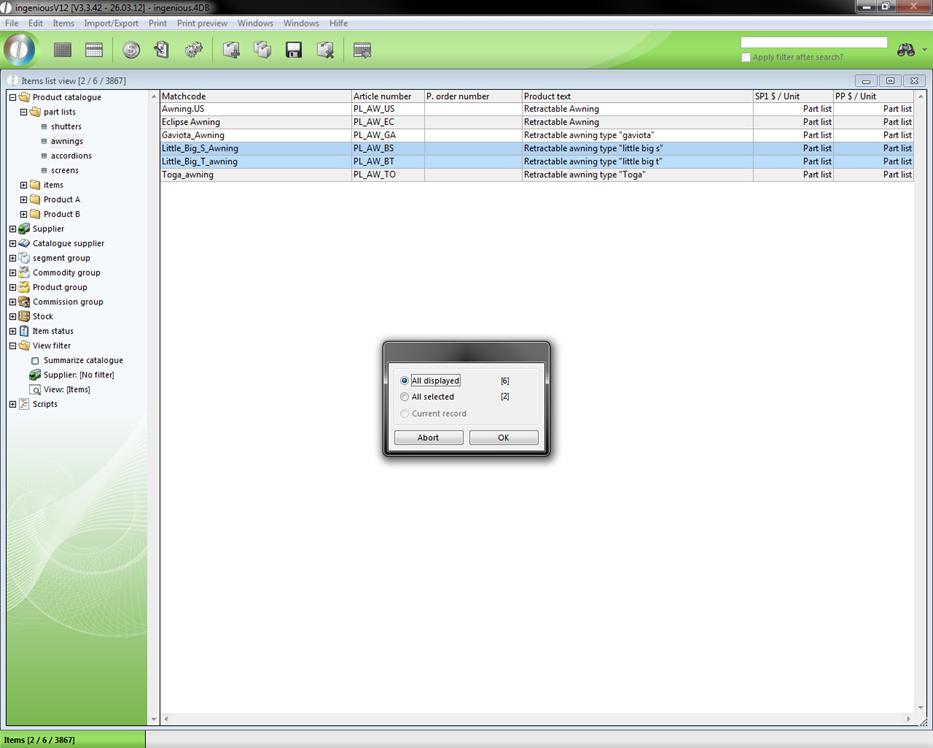
If you mark the option, “Show print dialogs”, the Windows standard window appears for the establishment of the print characteristics, such as the printing device, the paper size or the printing format, for example. If you do not select the option, the print job is sent to your standard printer and processed.
4. The window for the supplier selection follows. For this example, select the company “Supplier1”.
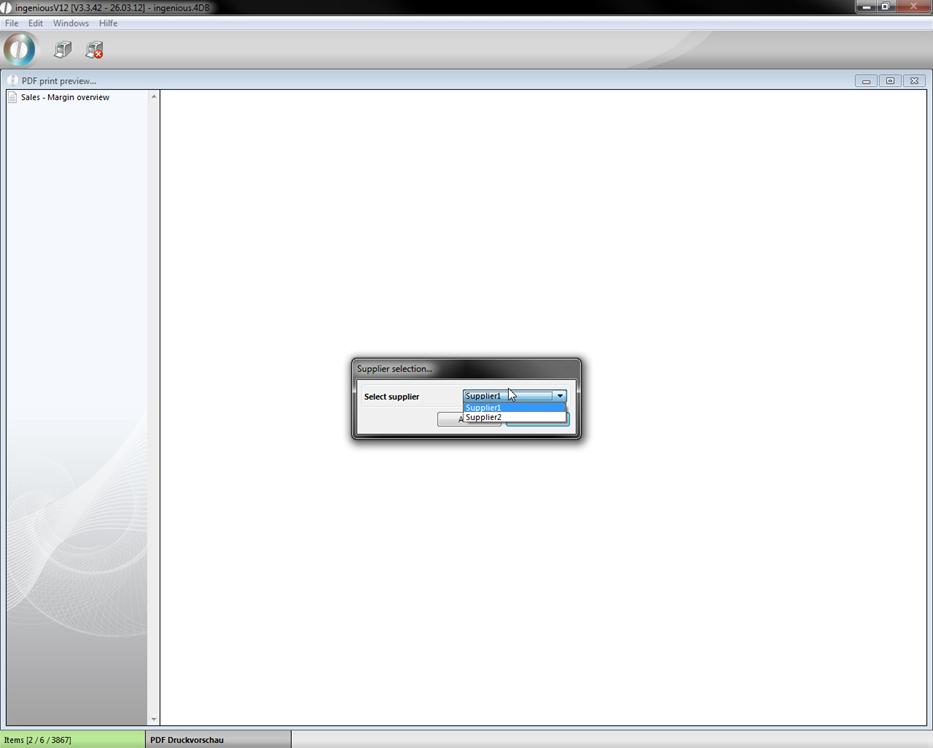
Note: If your company manufactures items, you should also absolutely incorporate suppliers into your database.
5. Now the print preview appears. Here you have the printout in one view.
If your print job covers several sides, you can navigate with the ![]() and
and ![]() buttons. With the
buttons. With the ![]() button, you can somewhat increase the view of the page in order to also recognize the details. The
button, you can somewhat increase the view of the page in order to also recognize the details. The ![]() button is used to abort the print job. If you use this, the window will close and the printing job is canceled.
button is used to abort the print job. If you use this, the window will close and the printing job is canceled.
6. Click on the ![]() button to start printing.
button to start printing.
Product statistics
The item statistics is a new function added to Ingenious.V12. With its assistance, a quicker overview and detailed evaluations of an item or a group of items during a certain time period are possible.
Creation of an product statistic
In order to create an item statistic, open the “Printing reports” column in the “Program settings” administrative tool. There you create a new report with the ![]() button.
button.
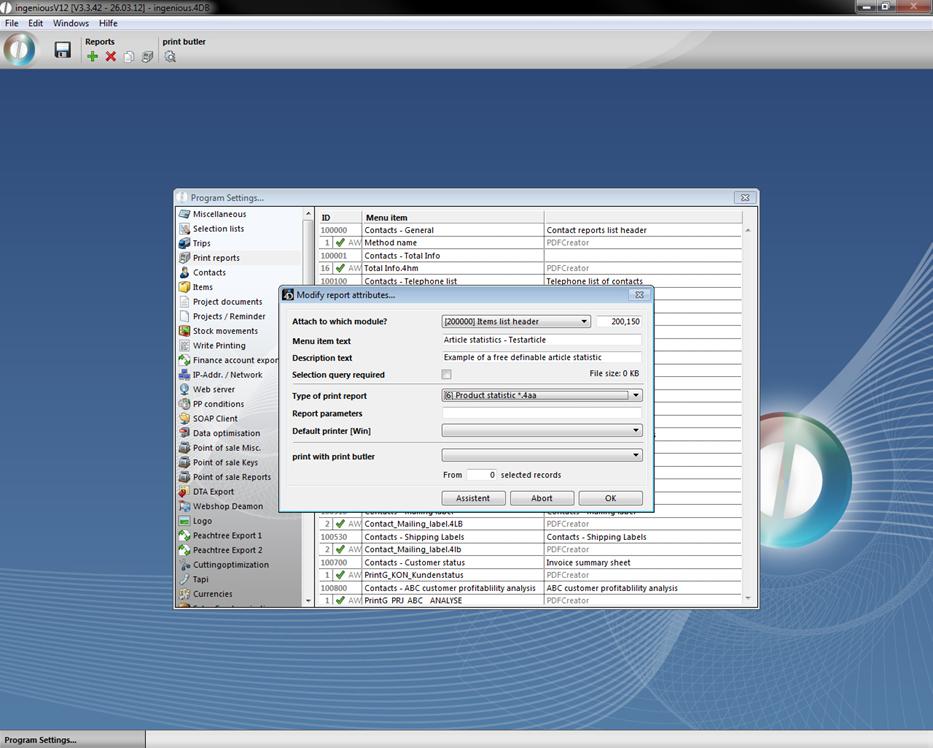
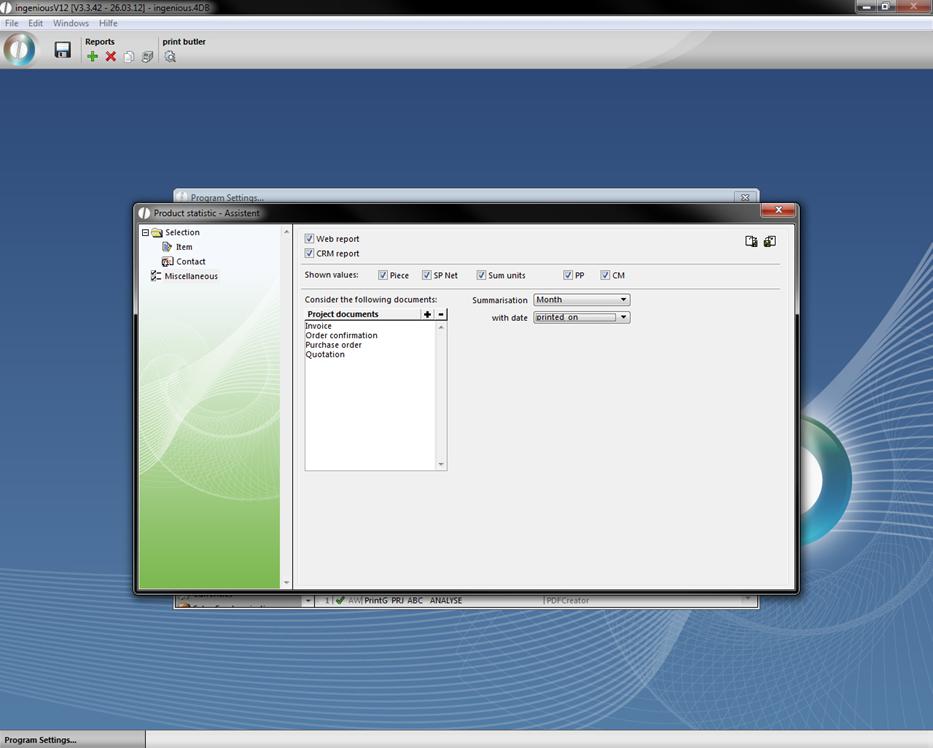
Window for creating a new statistic
In the field, “Attach to which module?", you determine from which module the statistics should be made available. After you have filled out the remaining empty fields and have selected the options “Product statistics *.4aa” in the “Type of print report”, open the assistants with the ![]() button. The assistant covers the 3 columns “Position”, “Contact” and “General”. With their help, you have the possibility of specifying all criteria of the statistics. In the selection settings of the “Position” area, the items, across which the statistics should be conducted, should be given with the actual matchcode and the individual description of the printout. In order to add an item, click on the
button. The assistant covers the 3 columns “Position”, “Contact” and “General”. With their help, you have the possibility of specifying all criteria of the statistics. In the selection settings of the “Position” area, the items, across which the statistics should be conducted, should be given with the actual matchcode and the individual description of the printout. In order to add an item, click on the ![]() button and enter the Matchcode directly. If several items are to be specified under a general/summarized name in the statistics, you can insert them successively and separately by a semicolon into one line.
button and enter the Matchcode directly. If several items are to be specified under a general/summarized name in the statistics, you can insert them successively and separately by a semicolon into one line.
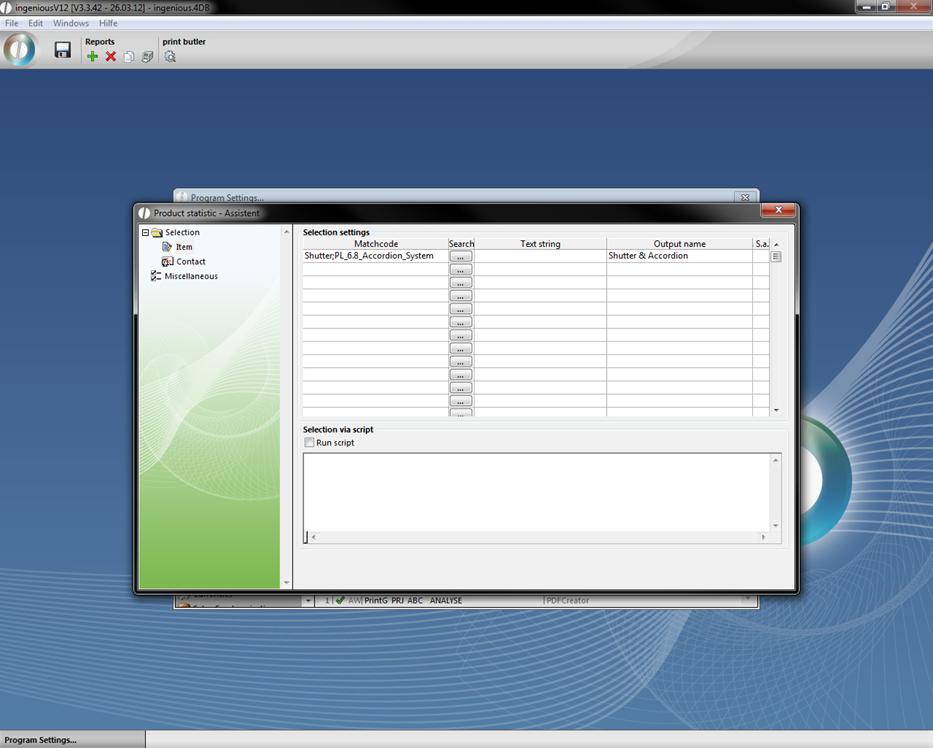
With the line “Text string”, the statistics result can be further refined. For example, there could be a parts list in the product catalogue called “Roller shutter AutoM4”. This roller shutter can be purchased in various materials and color variations. If only black roller shutters are to be used in a statistic, then “Black” is written in the field, “Text string”. Thus Ingenious.V12 filters all roller shutters “Roller shutter AutoM4” with other colors from the statistics.
With the column “S.a.”, you also have the possibility of refining the statistics even further. Click on a cell in the column and a “Yes” automatically appears. When repeating this, the cell is empty again. If “Yes” is listed in the cell, then the items are not only taken into the statistics if they are individually sold, but also if they are part of a larger product (and specified in their parts list). This is seen for example with the electric motor of the roller shutter “Roller shutter AutoM4”. All electric motors that were sold either individually, as spare parts for example, or as a component of a roller shutter, are thus now included in the statistics.
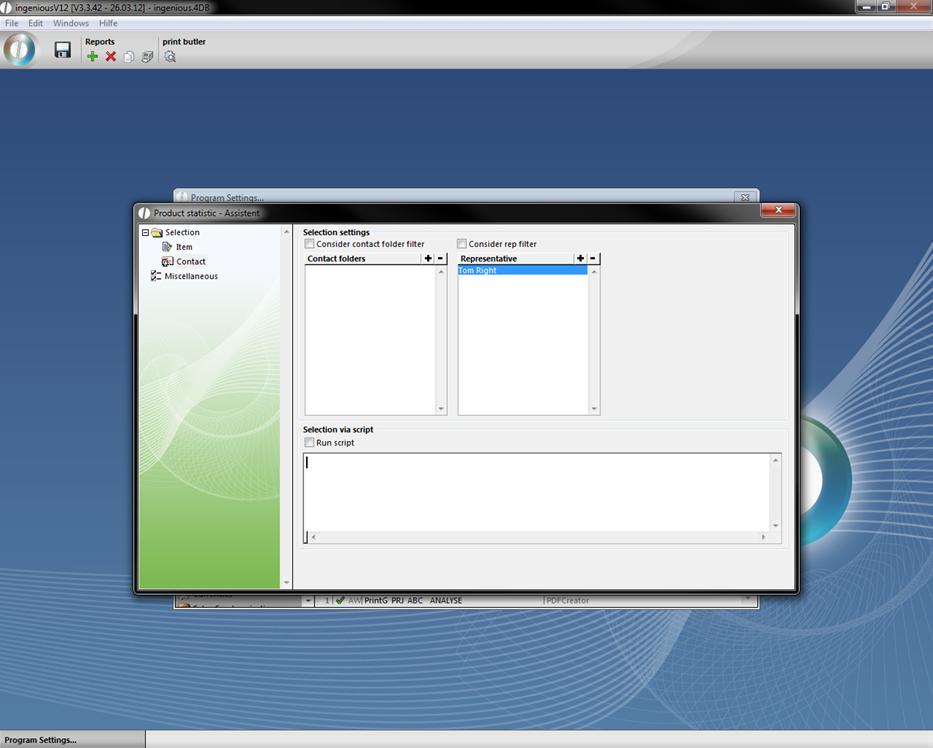
In the “Contact” column, representatives and contacts can also be selected. If you would only like to have items that are sold by a certain representative or by a certain contact in the statistics for example, then you have the possibility to do so here.
Under “General” the availability, layout and sources of the statistics are determined. If access to this statistic is to be permitted by the representatives outside of the company network, thus by Web access, you can determine this with a checkmark next to “WEB report”. A checkmark next to “CRM report” is set up so that you can show a contact-specific item statistic in the column “CRM Information” in the contacts detail view. To which module the statistics is to be attached is determined by you in the field “Attach to which module?” of the window “Report characteristics”. You can determine the layout to the extent that you have the choice between the values to be analyzed: “Piece”, “SP Net”, “Sum units”, “PP”, and “CM”. In addition, in the selection field, “Summarisation”, you can determine the time period of the statistics in three stages: “WK” (= calendar week), “Month” and “Entire FY”. In the “Project documents” field, you specify in which type of documents (in their positions), items belonging to the statistics is to be searched.
When you have updated all of the settings, you can close the “Item Statistics - Assistant” window and work on the “Report characteristics” window and confirm it with “OK”. Subsequently, the program settings will also be closed. Do not forget to save the settings.
Application of product statistics
In order to be able to use the statistics, you need the corresponding report rights, which you can work on in the user administration. Here the statistics just provided are by default refused to each user.
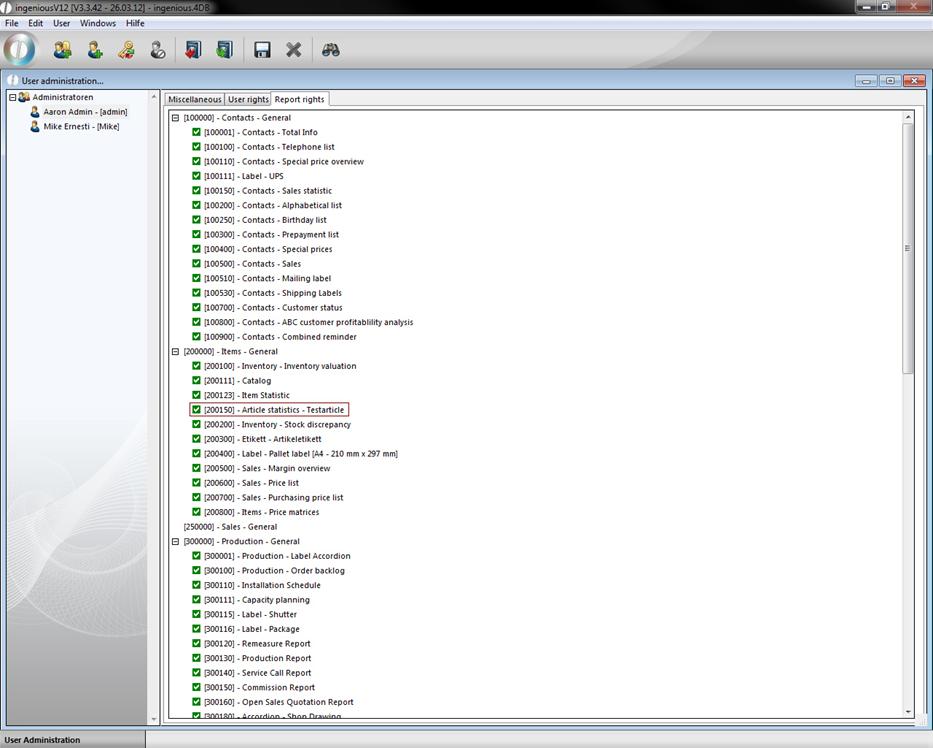
In order to be able to use the statistics, one must double click on the red cross to activate and give oneself the right. If you now open the module “Items” again, you will find the statistics under the menu item, “Print/Item statistics – Test items”.
After you have started the statistics with the appropriate menu option, an inquiry window appears to specify the time period. Enter the desired data either directly with the keyboard into the corresponding field, or use the calendar button to update entries with the mouse.
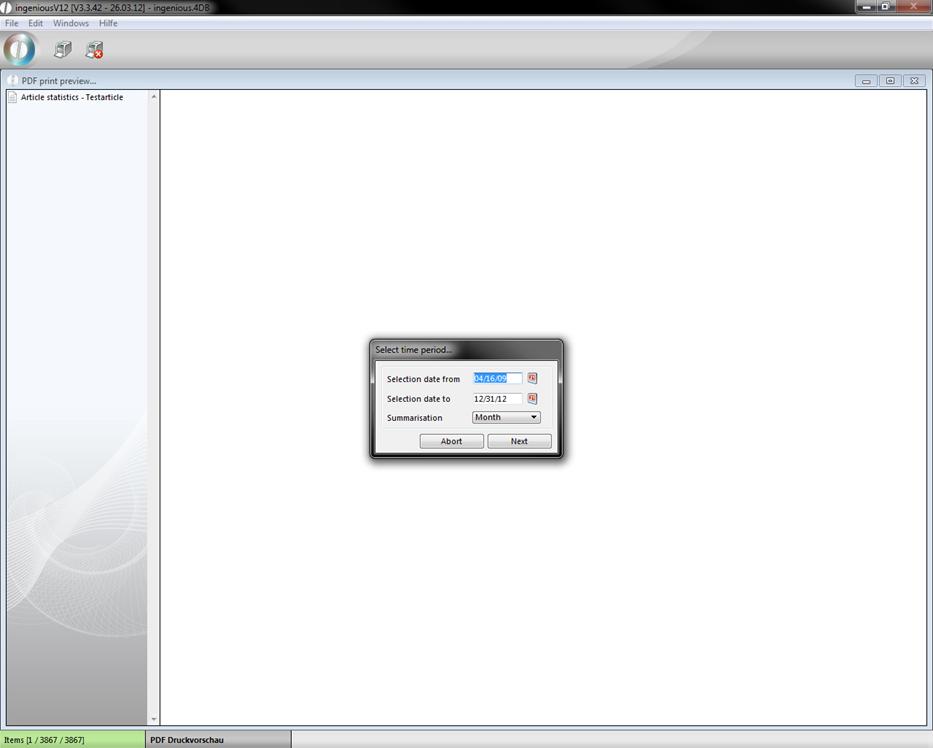
If you confirm the time period with the button, Ingenious.V12 immediately begins with the processing of the data. This trial process is shown to you with the appropriate window. As soon as Ingenious.V12 terminates the processing, the statistics appears on the monitor.
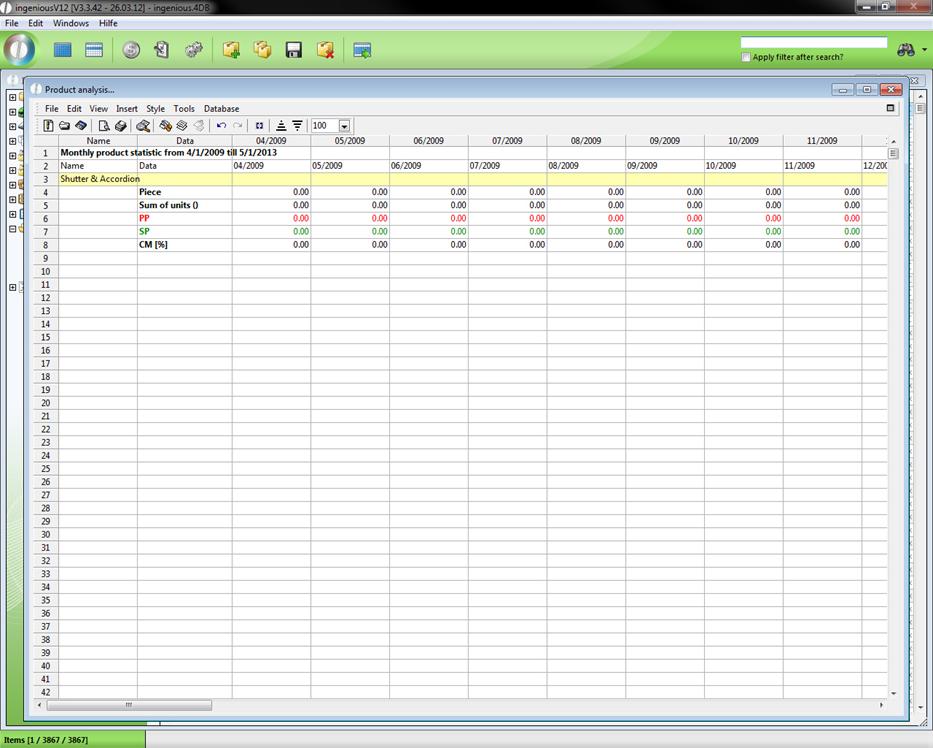
In the item statistics just provided, you can follow the monthly graduated sales process (Piece, PP, SP, CM) of the appropriate items. A printout of the statistics is possible by using the menu option, “File/Print Document…” or by clicking on the ![]() button.
button.